skip to main |
skip to sidebar
Star plot

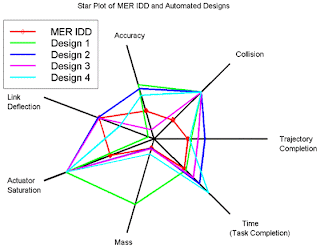
A star plot is a graphical data analysis technique for examining the relative behavior of all variables in a multivariate data set. The star plot consists of a sequence of equi-angular spokes. Each spoke represents a different variable in the multivariate data set. This star plot shows attribute relationships between 5 different designs of a product.
http://upload.wikimedia.org/wikipedia/commons/0/09/MER_Star_Plot.gif


No comments:
Post a Comment