
Tuesday, January 26, 2010
LIDAR
Doppler Radar

A Doppler radar uses sound waves to visually depict weather patterns. Weather forecasters use this technology to predict weather. This is a Doppler radar image of central Florida during a hurricane.
http://www.weatherusa.net/blog/images/doppler-orlando-1943.gif
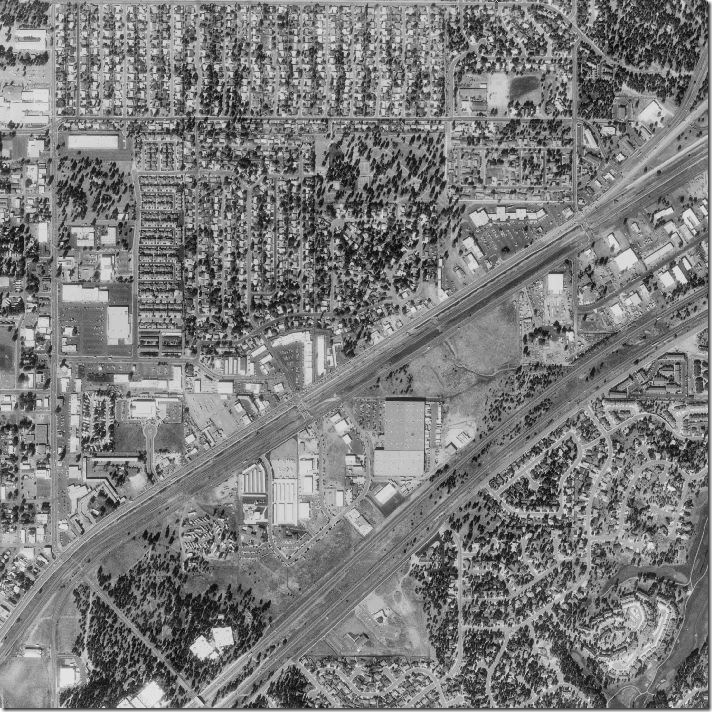
Black and White Aerial Photo

Black and white aerial photographs can be very beneficial in showing landforms, vegetation, and resources. They make landscape features more easily understood on a regional, continental, and even global scale. This photograph shows a neighborhood and major highway.
Infrared Aerial Photo

Geographers use a camera to capture a certain band of light called infrared. These images can be used specifically to document changes in the environment and the health of forests, wetlands, bays and oceans. This image shows water near land plots.
Cartographic Animations
.png)
A cartographic animation is a map that has moving aspects which show us what could happen under certain circumstances. In this case, the animation shows the development and movement of Hurricane Katrina.
Statistical Map

Statistical maps are based upon numerical values and gives a standard statistic with regards to a specific period of time. The given map depicts statistical changes in burglaries in the Denver, Colorado area.
Cartogram

Cartogram maps scale the area of each country in proportion to its population. The shape and relative location of each country is retained to as large an extent as possible, but a large amount of distortion tends to always exist. This map shows the amount electoral votes each state got by the number of squares that make up the state.
Flow Map

A flow map shows the movement of objects from one place to another. This flow map shows total combined truck flows for Texas.
Isoline Maps

Isoline maps are a two dimensional representation of a three dimensional model. An isoline map give you a picture of the concentration of people.
Proportional Circle Map

Proportional circle maps display data in relation to the size of the circles. In this map data is displayed of internet users in Europe.
http://jeffhobbs.files.wordpress.com/2008/03/1.gif
Tuesday, January 12, 2010
Choropleth Map

Dot Distribution Map

Dot distribution maps are used to show the presence of a feature or occurrence and display a spatial pattern. The map shown here shows the size of populations of cities in the United States based on dot distribution.
Propaganda Map
 A Propaganda map is created to express a biased opinion and convince others of it, usually exaggerating specific features. This map in particular is a political satire showing President Reagan's view of the world.
Hypsometric Map
 A Hypsometric map, also known as a relief map, is a map depicting the configuration of the earth’s surface, called the “relief,” by means of contours, form lines, hachures, shading, tinting, or relief models. The specific map is a topographic hypsometric map of the Goiania Metropolitan Region.
PLSS Map
 PLSS stands for Public Land Survey System. These maps are used as a way of subdividing describing land in the United States. This map in particular is a section of Minnesota divided into sections by townships and ranges.
fairview-industries.com/standardmodule.mn-exmp2.gif
Monday, January 11, 2010
Cadastral Map

A Cadastral map shows the boundaries and ownership of land parcels. In this particular map, colors depict they type of land usage.
Thematic Map
 Thematic maps show geographic patterns in statistical data, such as population or median income, displayed as color-coded areas on a map. The map shown here is a thematic map showing the population percent change of the United States between 1990 and 1996.
Topographic Map

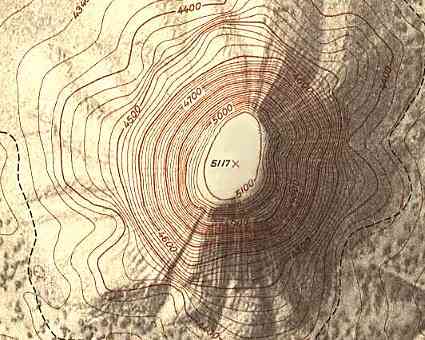
A Topographic map is a map that shows the relief of an area using contour lines to represent the size, shape, and elevation of the features. In this map, the contour lines are showing the elevation of this mountain.
Planimetric Map
 A Planimetric map is a map that represents only the horizontal positions of features and not the vertical positions, like heights, which a topographic map shows. This map in particular was used in the preliminary design of a transportation project.
Tuesday, January 5, 2010
Mental Map
 This map is an example of a mental map. The artist drew a map of her neighborhood from memory. Mental maps represent what an individual knows about the physical characteristics of a place and what he/she feels is important. Mental maps can be any scale, from a map of one's closet in a house to a map of the continents and oceans.
fasica.altervista.org/adam/adam_en.htm
Subscribe to:
Comments (Atom)
