skip to main |
skip to sidebar
Scatterplot
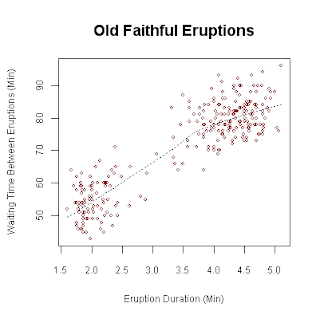
In a scatter plot the data is displayed as a collection of points, each having the value of one variable determining the position on the horizontal axis and the value of the other variable determining the position on the vertical axis. This scatter plot shows the relationship between waiting time between eruptions and eruption duration of Old Faithful.
http://upload.wikimedia.org/wikipedia/commons/0/0f/Oldfaithful3.png


No comments:
Post a Comment